
Statistical Process Control: How SPC Reduces Manufacturing Defects
Introduction
A Modern manufacturing is becoming more connected, but quality information can still be spread across inspection records, spreadsheets, reports, and different systems. When information is not connected, identifying trends and tracing the source of an issue can cost time.
A connected digital quality system changes this by bringing quality data together, making it easier to trace, analyse, act, and continuously improve. SPC doesn’t wait to catch defects after they happen. SPC helps you catch the signs of a defect before a bad part is made. Here’s how it works, why it matters, and how to digitizing it – with a platform like Live!QC Tools – makes it a whole lot more effective on the shop floor.
A Tale of Two Shifts: Traditional SPC vs Digital SPC in Manufacturing
Consider a precision CNC milling operation producing critical automotive shafts. Tool wear naturally occurs over time, causing dimensions to slowly drift toward the upper specification limit. In a Traditional workflow, an operator measures parts every two hours, manually records numbers on a clipboard sheet, and leaves trend analysis to end-of-shift reviews. By the time the shift supervisor notices an upward trend, fifty out-of-spec parts have already been machined.
In contrast, when a digital SPC module is integrated with a digital checksheet on the shop floor, each measurement entered automatically updates the control chart and creates a traceable record. The system captures key details such as the operator, date and time, equipment, process and measurement result providing the documentation required for audit readiness. This gives quality teams immediate visibility into process behaviour and enables them to identify trends based on the eight Nelson Rules as they occur. With reliable, real-time data and complete traceability at their fingertips, operators can proactively pause the machine and adjust the tool offset before a single defective part is produced. This shift from reactive firefighting to informed, proactive intervention – supported by accurate records and an audit-ready history.
How SPC finds unstable Process before they happen
This is where SPC becomes a genuinely predictive tool rather than just a record-keeping exercise.
Control charts are used to visualize patterns that validates a process is drifting. In modern digital systems like Live!QC Tools, the process is evaluated against standardized statistical rules to identify special-cause variation. Even if all parts are within the tolerance band, these rules can signal that a process is no longer acting normally.
This is the key difference between SPC and simple inspection. Inspection tells you whether a part is good or bad after it is made. SPC tells you that the process itself is becoming unstable – giving your team time to intervene before any defective parts are produced.
In addition to control charts, manufacturers employ capability indices like Cp and Cpk to address a different question: if a process is stable, can it meet the customer’s specification all the time? A process can be perfectly “in control” and still be too narrow, too wide or off-center relative to the tolerance band. Cp and Cpk measure the gap, allowing teams to determine if a process requires redesign, rather than just monitoring.
Understanding Core SPC Metrics
Metric / Tool | Primary Purpose | What It Tells Quality Teams |
X-bar and R Charts | Monitoring process stability over time. | Whether variations are due to common causes (random noise) or special causes (assignable failures like tool wear or raw material inconsistency). |
Process Capability (Cp and Cpk) | Assessing potential capability. | Whether the total spread of the process fits within the tolerance limit, assuming the process is perfectly centered. |
Process Performance (Pp and Ppk) | Assessing actual performance. | How well the process is currently performing relative to specification limits, taking into account both process spread and centering. |
Meeting Regulatory Mandates through Standards
- Bridging the Gap: SPC as a Pillar of ISO 9001 and IATF 16949 Compliance. In the modern manufacturing landscape, Statistical Process Control is not just a productivity tool-it is a cornerstone of regulatory compliance.
- ISO 9001:2015 (Clause 9.1.3) explicitly requires to analyse and evaluate it to determine process performance, identify risks, and drive improvement.
- For those in the automotive supply chain, IATF 16949:2016 (Clause 9.1.1.1) elevates this to a mandate, requiring manufacturers to maintain process stability and capability throughout production.
- By transitioning from paper logs to a Digital Checksheet that automatically maps data against the 8 Nelson Rules, Live!QC Tools provides the precise ” evidence of process monitoring ” that auditors demand.
- This integration ensures that your capability indices Cp, Cpk, Pp and Ppk are not just numbers in a report, but living proof of a controlled, compliant, and audit-ready manufacturing environment.
Key Compliance Links:
ISO 9001 Clause 9.1.3: Mandates the analysis of data to evaluate the performance of the Quality Management System (QMS).
IATF 16949 Clause 9.1.1.1: Requires the monitoring and measurement of manufacturing processes to verify stability and capability.
Nelson Rules Integration: Provides the standardized statistical framework to satisfy the requirement for “identifying special-cause variation”.
Digital Audit Trail: Replaces paper records with immutable, timestamped data for seamless PPAP and customer audits.
How Digital SPC Transforms Paperwork and Spreadsheet-Based Quality Control
Digitizing Statistical Process Control does not change the underlying statistics, but it fundamentally improves how quickly and reliably organizations can respond to them. In many plants, SPC remains ineffective on the shop floor because it depends on paper charts, manual paperwork, and standalone spreadsheets. Although spreadsheets may reduce some manual effort, they often lack complete traceability, audit trails, and reliable records of who entered or changed data-making audit readiness difficult. In a traditional environment, an operator takes a measurement, records it on paper or in a spreadsheet, and moves on. This process is the reason to transcription errors, missing information, delayed review, and incomplete documentation, limiting the organization’s ability to identify problems and take timely corrective action.
- Eliminating Human Error:Manual plotting and calculation are highly error-prone, especially under the pressure of production. These errors often sit unnoticed in paper binders until a quality escape occurs. Digital entry ensures calculations are exact and instant.
- Instant Traceability:With paper logs, retrieving process data for a specific lot can take hours or even days of searching through archives. Digital SPC provides full traceability in seconds, making customer audits and quality reviews effortless.
- Connecting Disconnected Data:Paper charts are isolated in binders, making it nearly impossible to identify trends between shifts, machines, or different plants. Digitization breaks these silos, allowing Quality Heads to see a unified view of process health across the entire organization.
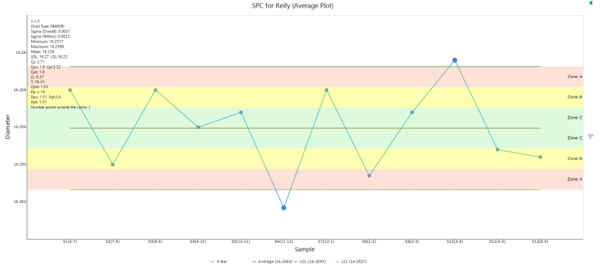
How Live!QC Tools brings SPC to life on the shop floor
This is exactly the gap Live!QC Tools SPC module is built to close. Rather than treating SPC as a separate, manual exercise bolted onto production, Live!QC Tools embeds it directly into daily quality workflows:
- Real-time control charts: Data from checksheets flows straight into control charts, so operators and quality engineers see process behaviour as it happens – not at the end of a shift.
- SPC rule-based detection: Nelson rule violations are detected automatically, so drifting processes get attention.
- Instant Cp/Cpk and Pp/Ppk calculations: Capability indices update automatically as new data comes in, so quality teams always know whether a process is capable of meeting spec-without manual number-crunching.
- One connected system through traceability: Because SPC sits alongside modules like NC/CAPA, Audit, etc. A special-cause signal can be linked directly to a corrective action.
- Visibility across shifts and plants: Dashboards roll up SPC data across machines, lines, and locations, giving Quality Heads and MDs a single view of process health.
Key Takeaways
SPC remains one of the most reliable ways to reduce defects in manufacturing because it addresses the root problem – process drift-before it becomes a quality escape. But its value depends entirely on how quickly signals are caught and acted on.
For quality teams still relying on disconnected system, digitizing SPC is often the single highest-leverage step toward fewer defects, faster response times, and audit-ready traceability-without changing the statistical principles that already work. Live!QC Tools SPC module is built to make that shift simple, turning SPC from a compliance exercise into a genuine, real-time tool.