


Try Live!QC Tools Today!
Plan activities, assign tasks, review progress in Operations, Quality, Management among other functions
Add, Classify, Group, Save, Share, Update in alignment with your Company Standards
Solve Issues, Perform Root Cause Analysis, Take Corrective Action / Preventive Action, Initiate Change Management
True Collaborative 8D Analysis with User-defined Templates, Cross-functional Team empowerment and tracking
Industry Standard Tools to ensure Quality, Analyze Data, Improve Business Processes Continuously
Teams deliver on challenges better when collaboration becomes easier and faster
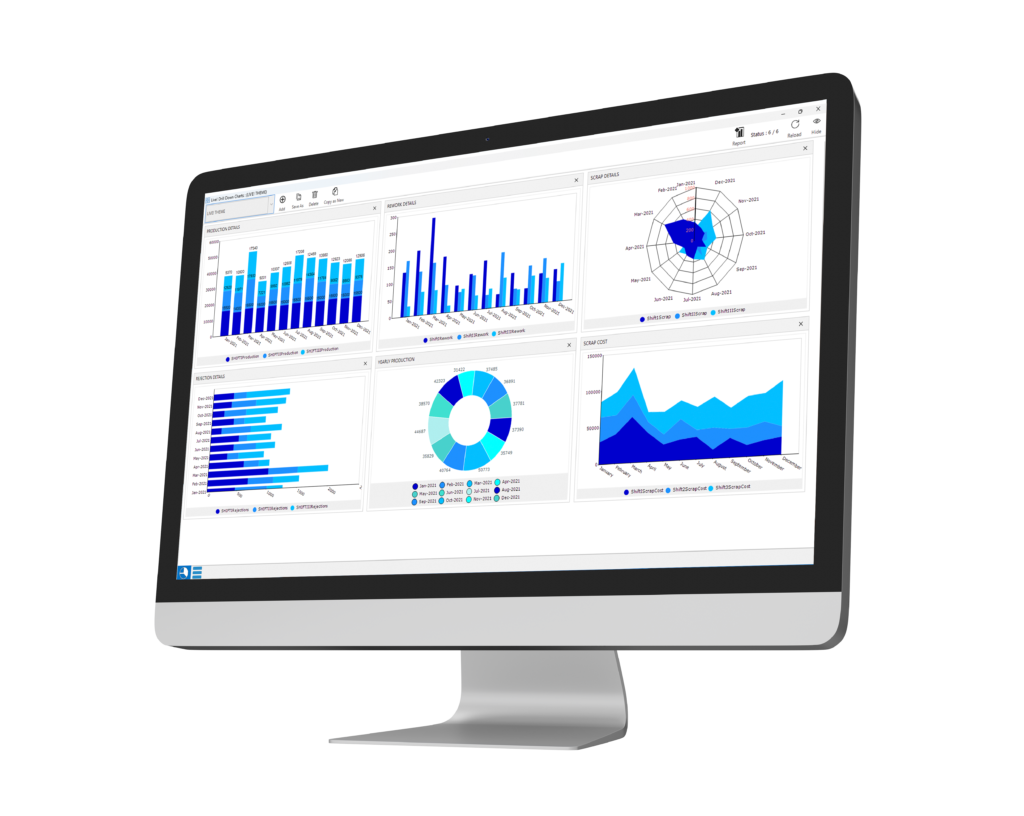
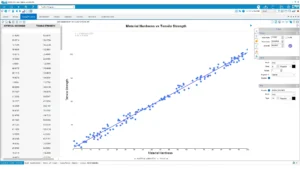
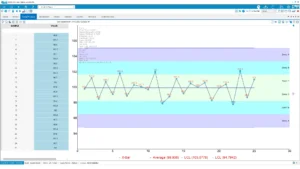
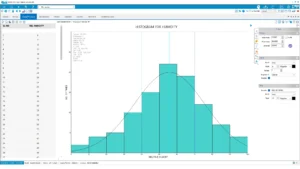
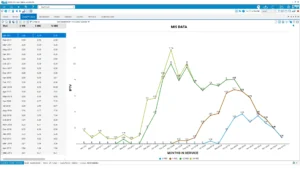
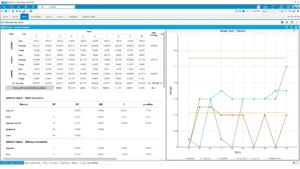
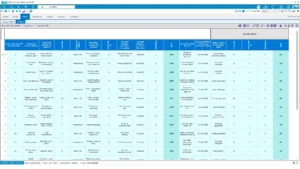
Numbers do not have the impact that Charts, Graphs and Diagrams provide. Data Visualization is the key to informed decision making
Answers from past issues, solutions empower teams to deliver faster, easier and in confidence
A systematic framework that outlines and records an organization's processes, procedures, and responsibilities aimed at fulfilling quality policies, practices, and objectives.
Live!QC Tools Software has been developed by a team of experts having experience in implementing best-in-class processes world-wide, helping organizations deliver on customer satisfaction while achieving Cost, Time & Quality Objectives.
Foundation of Live!QC Tools is incremental improvement in the results of clearly defined processes to achieve desired goals. Live!QC Tools is characterized by its simplicity, ease of use, and affordability Resources.
Unlock the full potential of your production process with Live!QC Tools, offering a comprehensive suite of Manufacturing Quality Management Tools. Our tools, including Data Collection, QC Charts & Diagrams, Planning & Task Management, Control Plan, MSA, FMEA,Parts , Defect Tracking, Drill-down Analysis, Root Cause Analysis- 8D, NC/CAPA/Issue/CR, Report Generation, Asset Control and Alert Trigger Settings.
Collaborating on an issue with people from different backgrounds can result in new ideas and potential solutions.
With complete visibility into process execution – who is doing what, when and where – companies can take steps to identify inefficiencies, rework and bottlenecks that are impeding progress.
To contrast a company’s actual performance and outcomes with the predetermined target parameters.
Customer satisfaction and re -business are determined by the total cost of ownership. To guarantee profitability and large market share, it is necessary to minimize the cost of processes.
Customer responses, time to market, and productivity are vital elements contributing to a business's success. Accurately measuring the duration of each activity is essential for adjusting to market changes, reducing expenses, and improving profitability.
Success of a business is fundamentally linked to the quality perceived and anticipated by the customer. This emphasizes the importance of quality once the product is delivered to the customer. Implementing Quality Assurance and Quality Control measures is crucial for maintaining customer loyalty.
Offer top-notch tools and technologies for an improved future.
Persistent faith in morality, good corporate citizenship, and principles.
While Presentation and Spreadsheet tools are excellent for starters, sharing, publishing, revising, tracking, categorizing, grouping them are cumbersome and sometimes not practical. Moreover, inviting feedback, recording actions taken are manual processes. Visibility to stakeholders is restricted to a few. At Corporate level, when collaboration across cross-functional teams deliver results, Live!QC Tools is a platform that is helps continuous process improvement. Live!QC Tools framework is a convenient environment for innovation, visibility of processes and an excellent repository for company-wide knowledge that can be put to use for the Organization.
Live!QC Tools provides a single framework for the entire organization to share and re-use data in a simple and efficient manner. It does not require very expensive / elaborate setup to Digitally Transform collaborative practices. Some of the unique features are:
7 QC Tools are enablers for problem resolution. By using Live!QC Tools the users are able to put their analyses together in a single framework and is available on demand across the organization. Past problems with solutions can be traced and ensured that the same issues do not arise again.
Live!QC Tools works on Microsoft Windows Professional Operating System. It requires either Microsoft SQL or PostGRESQL to work with. Since it is based on a Client-server architecture, the database can be hosted on a centrally located computer with IT providing access to the end users to use Live!QC Tools framework for collaboration and sharing.
Live!QC Tools uses charts, diagrams, and reports to present data in an understandable manner. For instance, ISO 9000 places a strong emphasis on data to support claims, team empowerment, traceability, risk management, and continuous process improvement. Here, Live!QC Tools gives users access to data in an easily readable format and allows them to provide evidence of compliance.